So, last week, I looked at the impact of closing elementary schools on mortality from Covid-19. In fact, for "closing elementary schools", you could probably read "closing lots of stuff, including elementary schools". The long and the short of it was that there was no clear trend one way or the other, with nations like Sweden and Belarus (that did not close elementary schools) having pretty much middle-of-the-pack results compared to other nations in west and east Europe, respectively. There was a hint that maybe closing early was better than closing late, but closing late was worse than not closing at all, but that might simply have been an artifact of the fact that the nations which got hit earliest, got hit hardest, no matter what their policy. The stronger trend was that the nations which got hit later, seemed to have gotten a less lethal variant (or mix of variants), and had far less total mortality, even when looking at equal amounts of time. It led to the optimistic possibility that the virus is mutating in a way which causes it to be less often lethal. But, does the same story hold true in the U.S.?
Let's look at all 44 states for which we have a population of at least a million, vs. the date they announced the closure of elementary schools. Some notes first:
Having said all that, here's the graph:
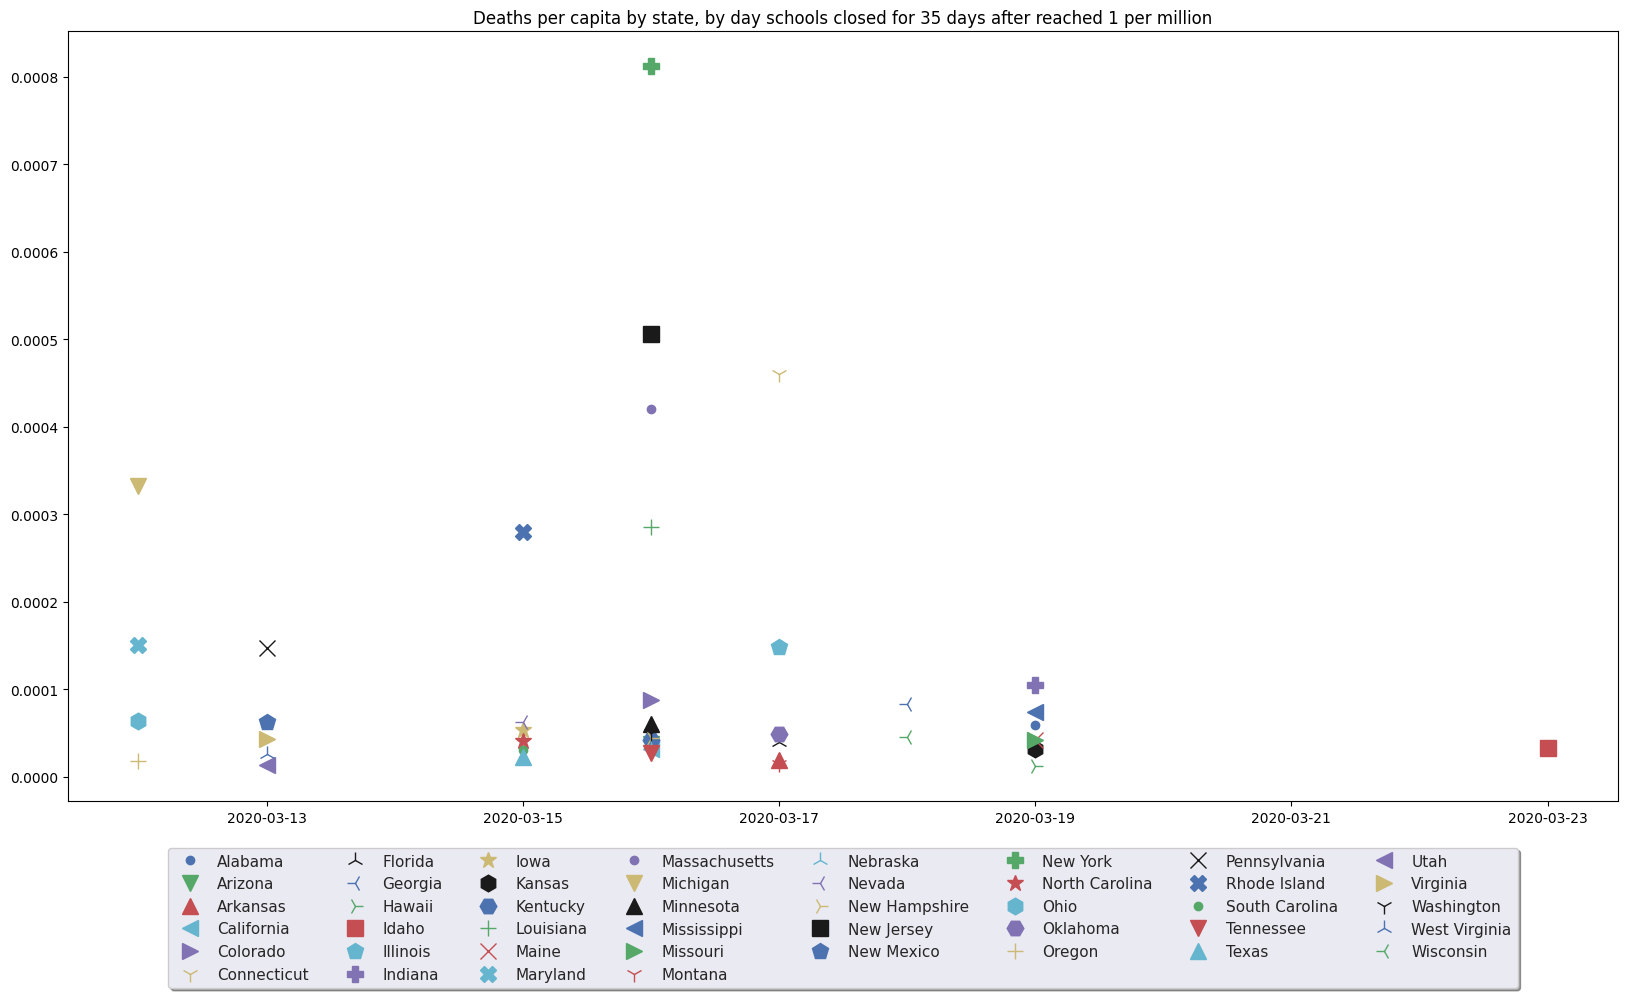
Well, as expected, that doesn't show too much. But then, nearly all the states shown announced the closure during the week of spring break, so functionally speaking they all closed at the same time. So really, there's no big surprise that it doesn't show much impact, because they all had more or less the same policy.
However, while they all closed schools at more or less the same time, they didn't all get the virus at the same time, so we can compare their date of school closure to their "day1" (the day when the total deaths reached 1 in a million). This would mean that the states which had the virus already well into the process of killing people before they closed, would be different than those which closed schools before that (not because they closed earlier, mostly, but because the virus arrived later). So, let's take a look at what that looks like.
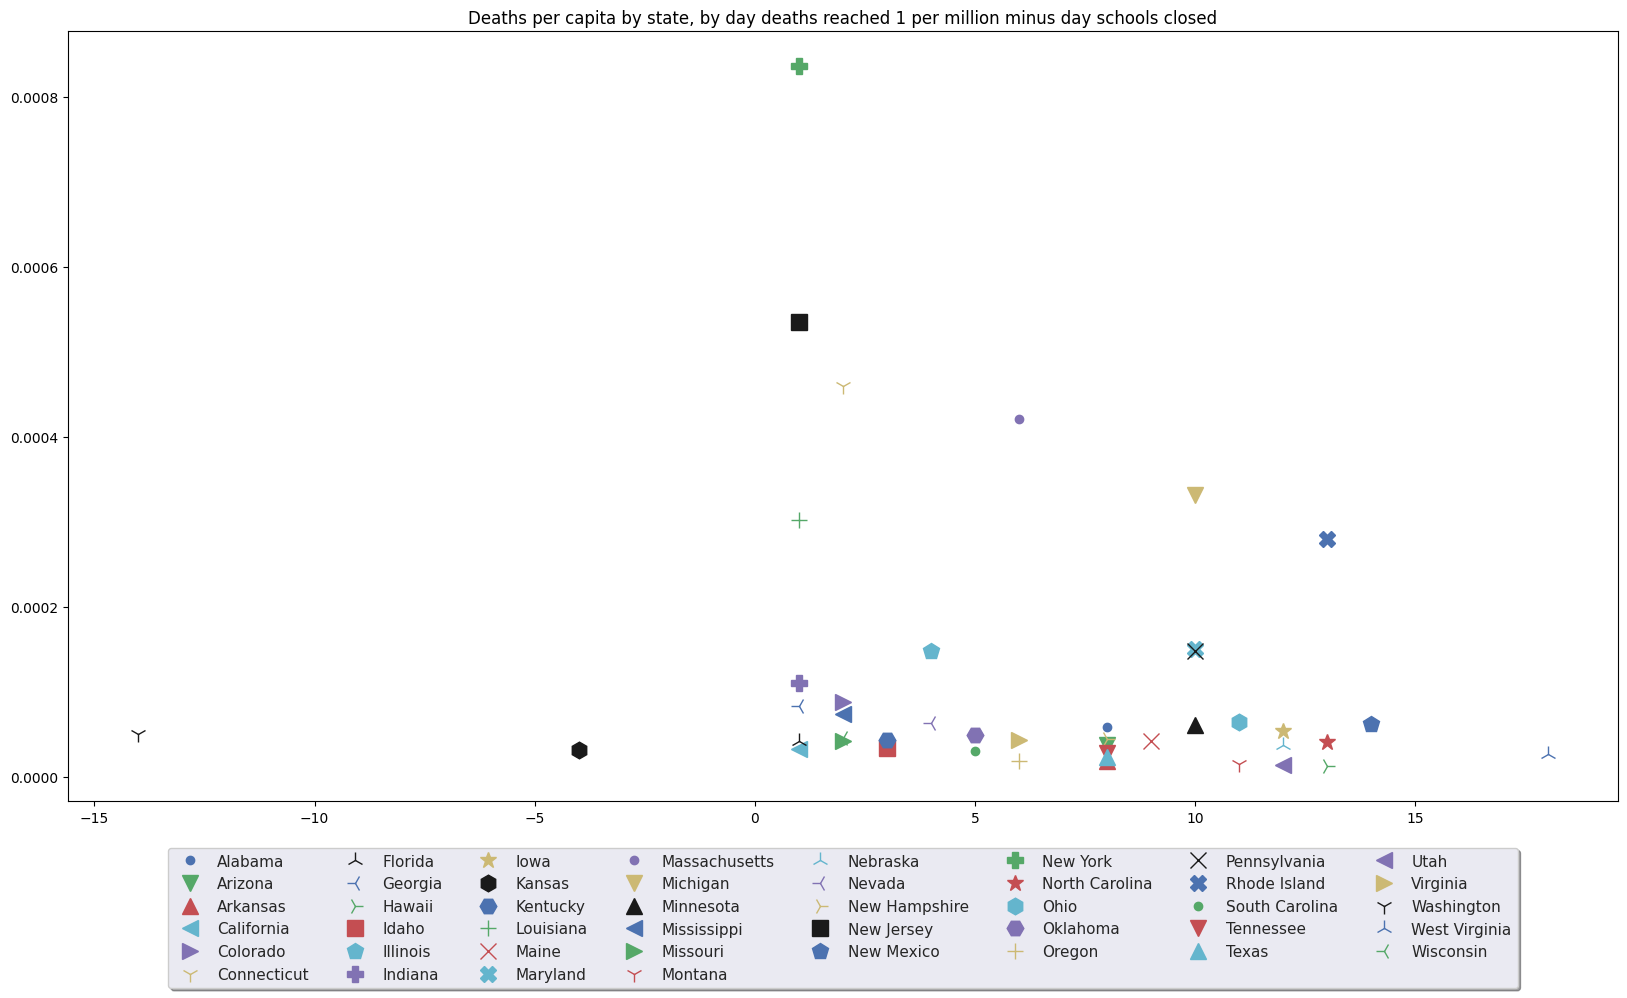
Hmmm. Still not a great signal. In fact, although there were a few states that have good results which closed relatively early (which is a negative number here, because the day they closed schools is less than their "day1" when deaths hit 1 in a million), the worst results are mostly all with intermediate numbers, between -5 and 5. This is similar to what we saw in a comparison of different European nations last week; closing early or very late (or never) both had better results than closing around the time the dying started. It reminds me of the "herd immunity" theory, which says that if you cannot get ahead of the virus in order to stomp it out early, you should not close at all. But, there are also plenty of states with relatively good results in the middle area between -5 and 5, so I think the most defensible conclusion is just that it doesn't appear to have much of an impact at all.
If you put your hand to block the "New York" point at the top, it becomes even more clear that there's not much of a trend here, one way or the other.
In the case of Europe, there is also a fairly strong signal if you just plot vs. "day1", and forget all about the date when the schools closed entirely. This suggests that, in Europe anyway, the nations that got it earlier, got a more virulent strain. This makes sense given the previously known tendency of novel viruses to become less lethal over time (presumably because the more lethal variants kill off their host before they get transmitted much). If you look at the American states, you see a somewhat similar pattern.
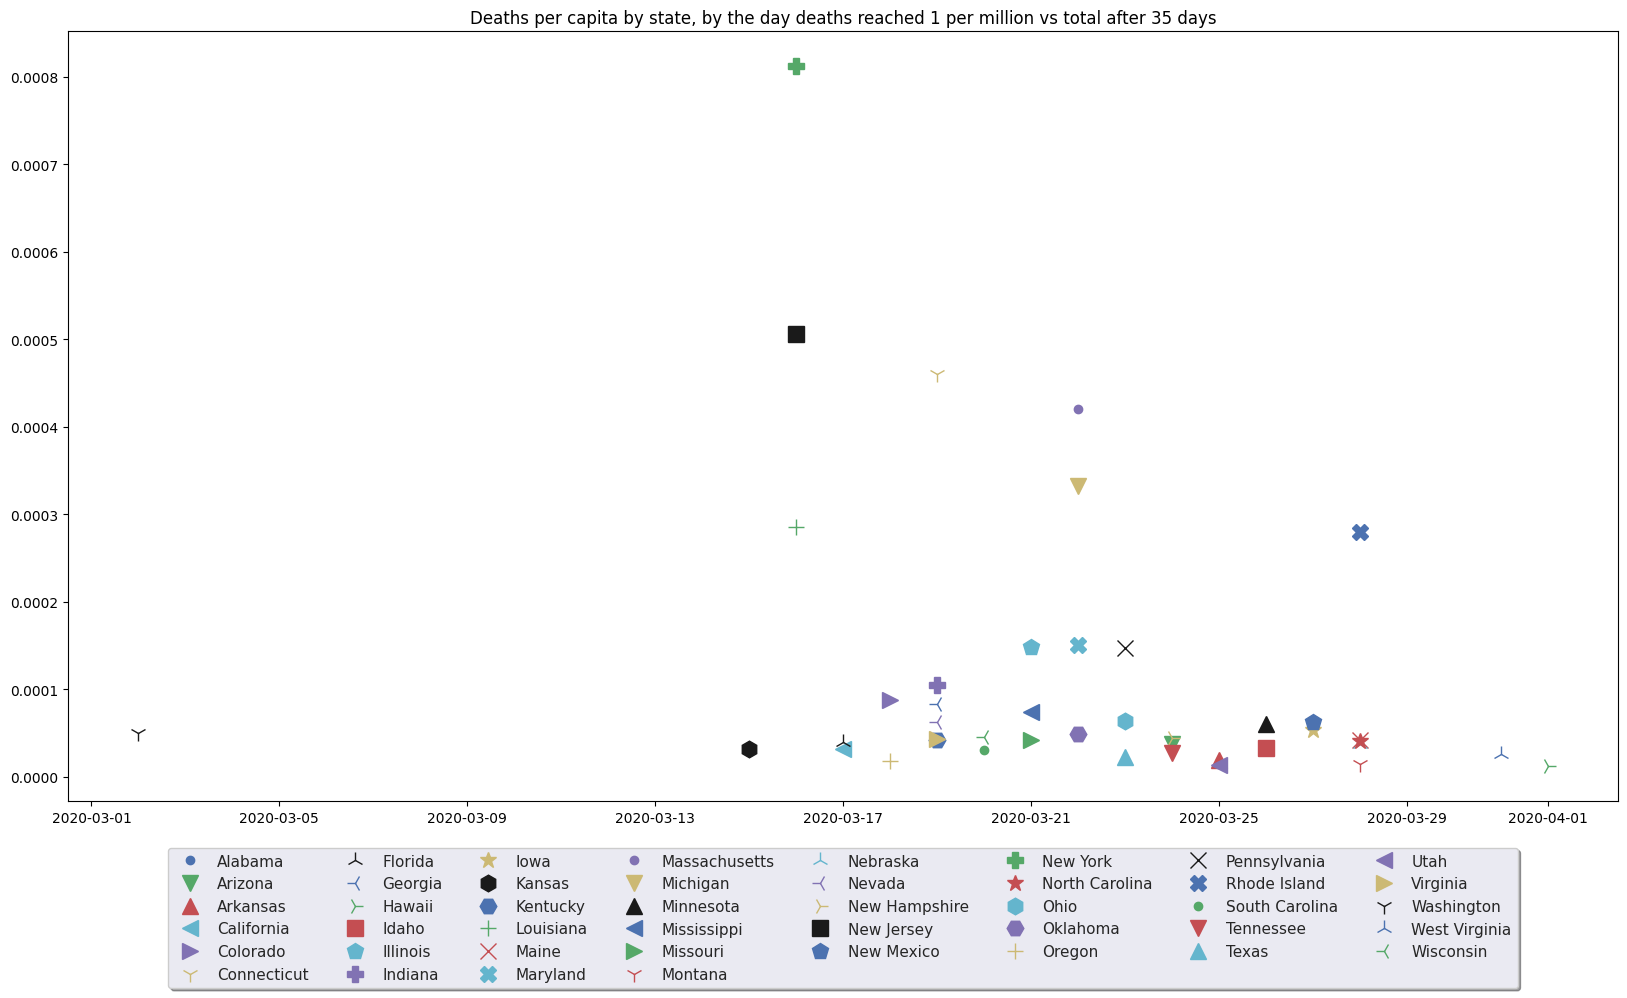
Washington state is, obviously, a bit of an outlier here, having reached a level of 1 dead per million well before anyone else. But, the rest shows a pattern of the worst results occurring in states that got hit early. Keep in mind, the totals here are, in all cases, covering only 35 days, from the "day1" when they first reached 1 dead per million. So the fact that the worst-hit were among the earliest hit, does not just come from the fact that they've had more time to die; all of these states are being looked at in an equal timespan, and all starting from when the dying had begun in that state.
So, given that this pattern looks somewhat similar to what we saw in Europe, I'm going to advance an hypothesis: New York got Europe's version of the virus, and Washington got Asia's. The death totals in the nations of Europe which got hit early, are orders of magnitude greater than the death totals in east Asia. I think Washington (and the other west coast states such as California) got the Asian variant(s) of the virus, and Europe got a different variant (or mix of variants). The Asian variant(s) had already begun to mutate in a way which led to lower mortality, but the European variant(s) had not (yet).
This also explains why the 7 states with the worst results, are all east of the Mississippi; they were more likely to have gotten the European variant (more lethal) before the Asian variant (less lethal, but similar enough to serve as a vaccine of sorts to the European variant). The good news is, that whatever process caused the Asian variant to become less lethal as it left Wuhan, has apparently recurred, in both Europe (see last week) and the U.S. The later the state got hit, the more likely that a goodly percentage of the population had already been exposed to a less lethal variant before the European version showed up.
All of which is probably much simpler than the complete details that will (hopefully) eventually merge. We know there are at least 198 variants of the virus that causes Covid-19, and nowhere that has it has only 1 variant. Each nation probably has many variants, only some of which have any impact on lethality. So the difference between nations is probably more the ratio of the mix, and the order in which they showed up. If Europe got the less lethal versions later than east Asia, even though both got all variants eventually, the result would (and appears to be) the same: the virus is changing in a way which makes it less often (but still sometimes) lethal.
This is, I believe, more or less unalloyed good news. There isn't any vaccine or cure showing up any time soon, but it does appear that the virus is changing in a way which causes it to be less often (though sadly probably not never) lethal. The death toll doesn't go down just because more people have already been exposed; it also goes down because the less-lethal variants are the ones that spread faster (because their hosts keep moving).
But, the other conclusion one can draw here, much stronger than the optimistic one that I just advanced, is that closing elementary schools does not seem to impact things one way or the other.