So, we are by no means done with the Covid-19 pandemic, but we've been going on long enough now to get some clear trends. I am looking here only at totals for deaths, which are not perfect but are much better than the totals for detected, suspected, or recovered. Different countries have different policies on testing, different capacity for testing, etc. and thus the totals for cases detected, especially when comparing countries, is more a comparison of testing than a comparison of the disease prevalence or severity.
I have dropped the Hubei province of China from this analysis, because widespread disputes about the accuracy of their death totals just clouds the issue. In any case, if you saw their numbers here, it would be more or less in the middle of the rest. All of this data is using the excellent John Hopkins repository, itself compiled from various national and international sources such as the WHO, CDC, European CDC, etc.
I am looking here at how it progresses in the different countries, not who started first; not that who started first is not interesting it's just not what I'm looking at here. Therefore, we find a "Day 1" for each country, that is different for each one. I am defining "Day 1" as the first day when the total deaths reached at least 1 in 10 million. So, for the U.S. (pop. ~330 million) this would be when the total deaths were at least 33, whereas for the Netherlands (pop. ~17 million), this would be the first day when the total deaths were at least 1.7, i.e. at least 2.
Eventually we will look at all 20 of these countries together, but when I do that, the first thing I think is, 'whoa, that is entirely too many lines in one chart'. So, let's break it down into some subgroups first, before we look at them all together. How about we look at the European nations first.
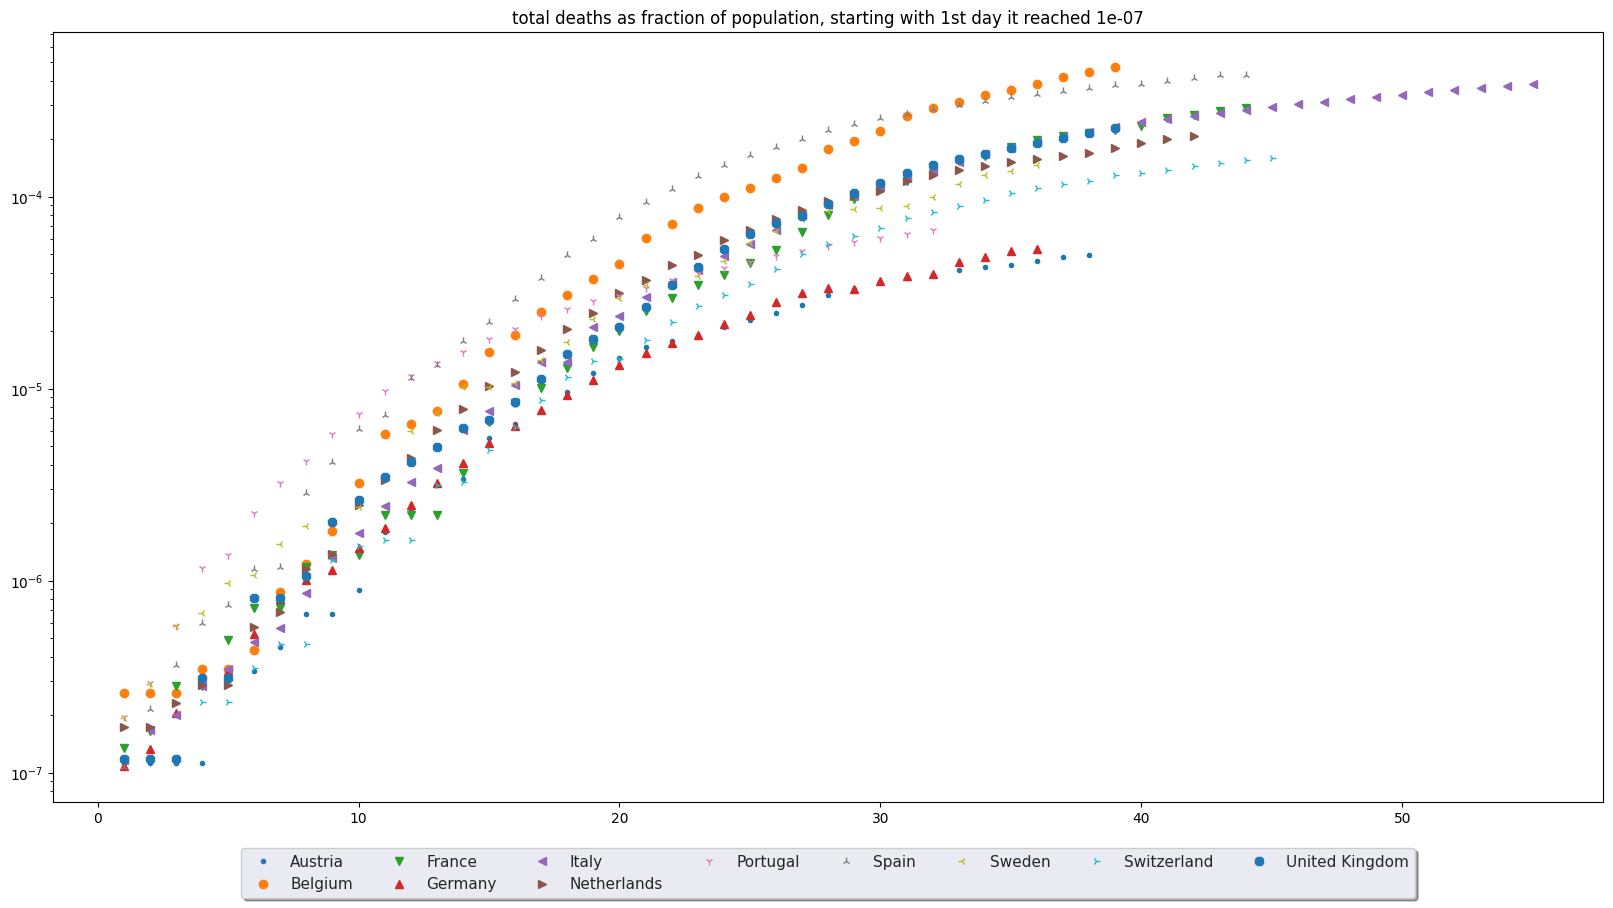
They still are all pretty close together, and that's our first takeaway. The countries with fairly drastic lockdowns (e.g. Germany, France) and the ones with late or no lockdowns (Sweden, UK, Netherlands) are not obviously in two separate groups. Actually the worst looking one here is Spain, one of the nations that was fairly quick to implement social distancing, whereas Sweden went the route of "herd immunity", and despite its very different policy is more or less in the middle of the pack. But really, look at France, Italy, and the UK; they're so much on top of one another you can hardly distinguish them (I bet France and the UK in particular hate that).
The second takeaway is that they have all, when viewed on a logarithmic y axis, slowed down. Why is that significant? Well, on a logarithmic y-axis, constant percentage growth rates will look like a straight line. If it doubles every two weeks, or otherwise grows by a set percentage every so often, the logarithmic y-axis will make it look like a straight line. The fact that they are all flattening out doesn't mean the absolute numbers are declining, but it does mean the exponential growth that makes it "viral", is declining.
Third, it does not appear that any of these lines are going to reach the top of the graph, which is less than 1 in 1000. This doesn't mean it isn't significant, but some of the dramatic predictions of 1% or even 10% mortality rates just don't look plausible, in any of these countries, no matter what their policies (which vary quite a lot). In fact, it doesn't look like any of them are going to reach 0.1%.
Let's look at Asia. For purposes of this blog post, I'm going to put Iran and Turkey into Asia (now they hate me).
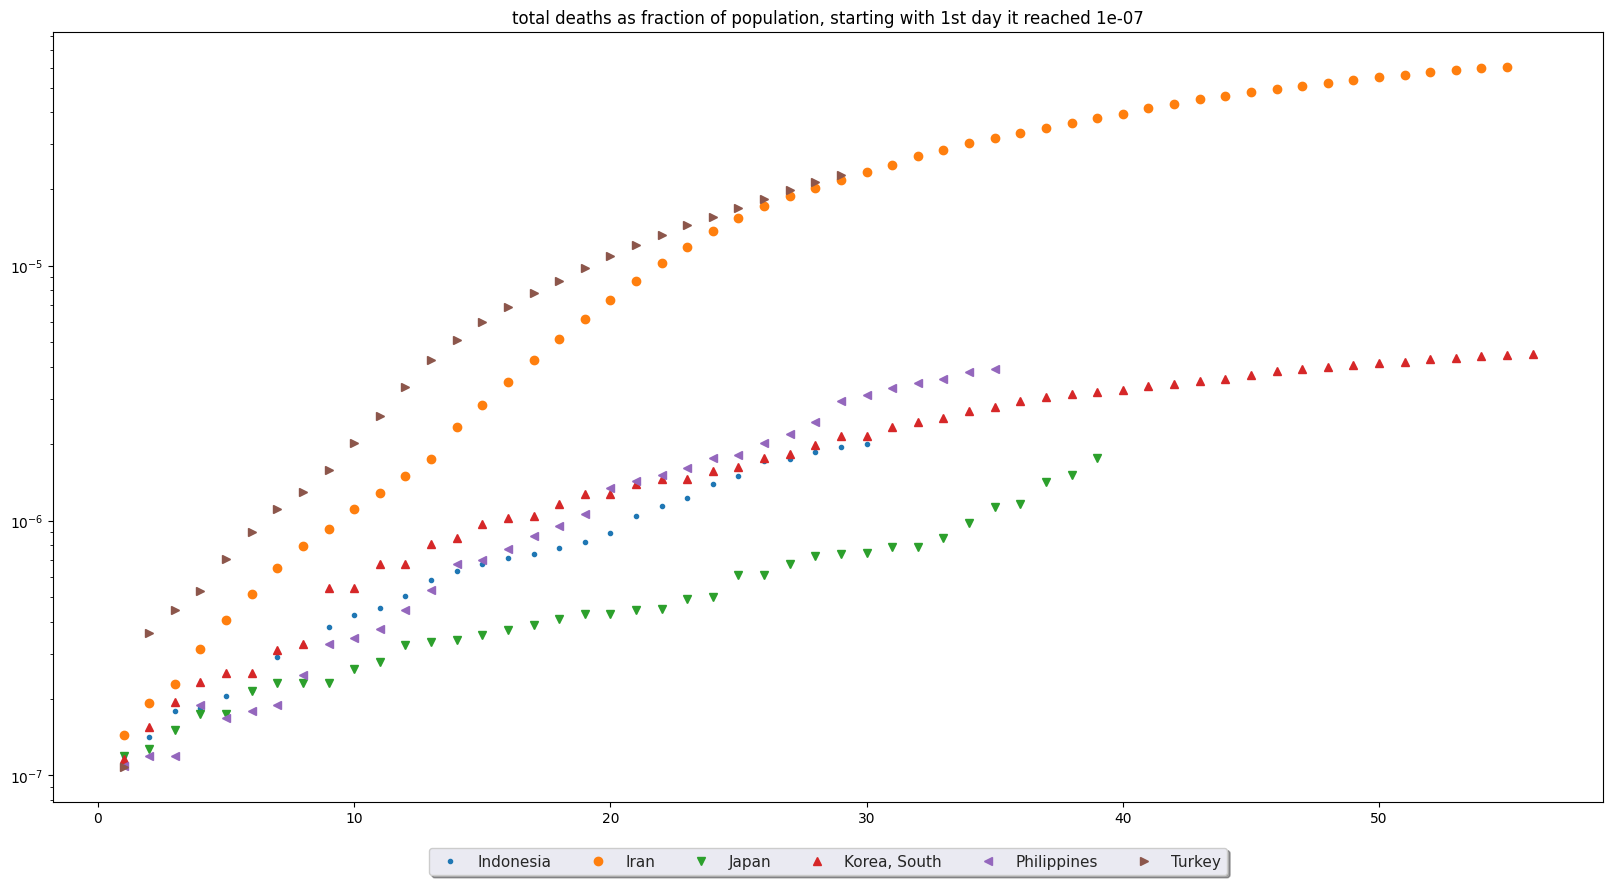
The first thing we notice here is that Iran and Turkey are doing worse than the others. If we had the Hubei province of China here, we would see that they look pretty similar, but Hubei recently revised their numbers in a way that makes the day-to-day progression pretty hard to deduce, so we're leaving them out. We also see that the Phillipines, South Korea, and Indonesia are all actually doing pretty similarly, despite a fairly big gap in testing capability, policy, and even health care systems. Japan is also doing substantially better, although it may be going to catch up to the rest eventually.
What may not be as obvious, is that the y-axis is quite a bit different than it was for Europe. The top of the scale here is less than 1 per 10,000, whereas for Europe the top of the scale was nearly 1 per 1,000. In other words, if we plotted Europe and Asia together on a linear (not logarithmic) axis, the Asian countries would all be down in the noise levels compared to Europe.
I find it disappointing that we have seen so little discussion of this. I think it may be that any mention of race or ethnicity brings up uncomfortable topics, but honestly we're talking about a virus here, not slavery or voting rights. There are numerous cases in which one race or ethnicity has a greater resistance to a disease (such as malaria or smallpox) than another, and this has been known for centuries. It is pretty clear that there is a difference between the European and Asian results. However...
You notice how we don't have Australia or New Zealand in here? That's because their death totals are so low they're not in the top 20 countries. In the case of New Zealand that is largely because they're just a small country, but Australia is not that small. If you check, you find that they have totals right now something like 1 in 100,000 or less. Of course, they are also in the southern hemisphere, and perhaps the weather difference (because they are in the southern hemisphere) has an impact here? If so, they will speed up right when the rest of the world slows down. In the meantime, it is hard to say, but if Australia and New Zealand are actually as Asian-looking in their apparent resistance to Covid-19 as it currently looks, then someone will have to come up with a convincing theory for how longitude could reduce Covid-19 deaths by an order of magnitude. In the meantime, let's look at the Americas.
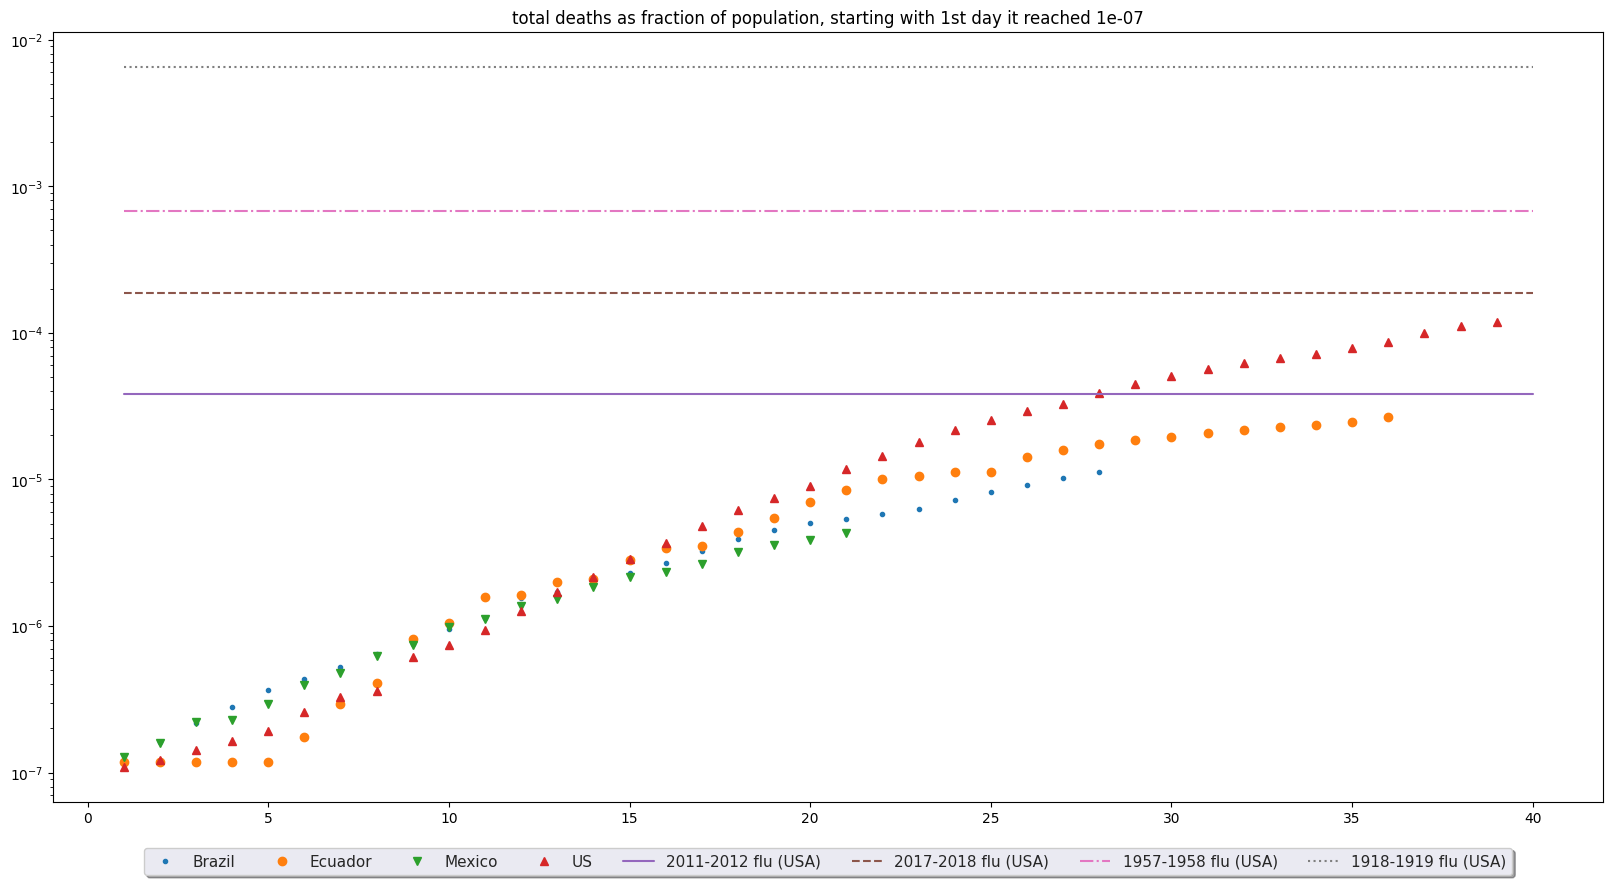
Here again there is more similarity than difference between the countries, although the U.S. is a little higher and Mexico is a little lower, with Brazil and Ecuador in between. These results all fall in between the European and Asian graphs, with the highest results around 1 in 10,000. The y-axis is a little squashed down here, because I'm including some lines (dotted, dashed, etc.) from past epidemics for historical comparison.
These lines indicate what the final death tolls looked like (in the U.S.A.) for four different seasonal influenzas. The lowest, the 2011-2012 winter, was the best case in the last decade or so. The 2017-2018 was the worst (in the U.S.A.) influenza outbreak in the last decade, for those years for which we have reasonably reliable totals (e.g. the 2019-2020 data is not really firm yet). The second-to-highest line is the 1957 "swine flu" epidemic, which was the second-worst of the 20th century, and the 1918 flupandemic was the worst (in total deaths in a year) ever recorded. Note that the y-axis is logarithmic, so the 1918 flupandemic was A LOT worse than the 1957, which was in turn a lot worse than the 2017.
From the looks of things, the U.S. is headed for a result similar to the 2017-2018 flu season. Now, that doesn't mean it's not a problem; that flu season killed a lot of people. But, it is worth noticing that we appear to be having a health calamity similar in scope to one which happened less than three years ago, and most of us didn't even notice at the time. This is not only NOT like the 1918 flupandemic, it's not even on the scale of the 1957 swine flu. Again, that doesn't mean it's not significant; we probably should have been paying more attention to the 2017-2018 flu epidemic. But, if you're paralyzed in fear in your house, wondering how you can ever go out again, it is worth remembering that you have lived through a crisis of a similar magnitude before, and didn't notice it.
You may be thinking, "but if we ever leave our houses, it will become so much worse!" Well, countries such as Sweden and Japan that have had little in the way of lockdowns, or had them very late, do not seem to be doing worse than the ones that are having lockdowns. When the time comes to go out into the world again, probably pretty soon, we should certainly try to be more mindful of health issues than in the past. Wash your hands. Stay home if you're sick. But I hope we don't decide that we are a society that can never meet in public again, because what we are going through now is not only not unprecedented; it's not the first time this decade. Maybe (probably) we should have paid more attention to the flu in 2017, or even in 2011, and definitely we should pay more attention to viruses in the future. But let's not let it paralyze us.
All 20 nations in one graph