This week, I have started looking at the "excess deaths" numbers from the CDC. Before the charts, a word about what "excess deaths" means. The CDC has, from historical records, an idea of how many deaths will be expected to occur, in the country, each state, and some cities like NYC. There is some variation from year to year, of course, but they have an idea of the normal range.
Then, as they get reports of deaths (from all causes), they can compare this to the expected range. This means more than just counting up how many have been reported and comparing it to the history, though. There is normally a lag, and this lag itself needs to be predicted. So, for example, if you've received reports of about 100 deaths in a particular area last week, and you know that one week after you will normally have received about half of the total number of reports that you will eventually get, you can predict that you will end up receiving about 200 reports of deaths from that jurisdiction, for last week (even though some of these reports will be many weeks late).
In addition, there has to be an estimate of how many deaths just never get reported to the CDC at all. So, you can see, these are not raw numbers, and they require a lot of work on the CDC's part to make a good estimate of what is happening on the ground. But, the CDC appears to be reasonably good at this kind of thing, and they've been doing it for a while.
So, if we're wanting to take a look at how the reaction to Covid-19 differs between, say, New York City and the state of Texas, it is useful to take a look at the CDC's graphs, even though we know they are only approximations. So, let's look at NYC first.
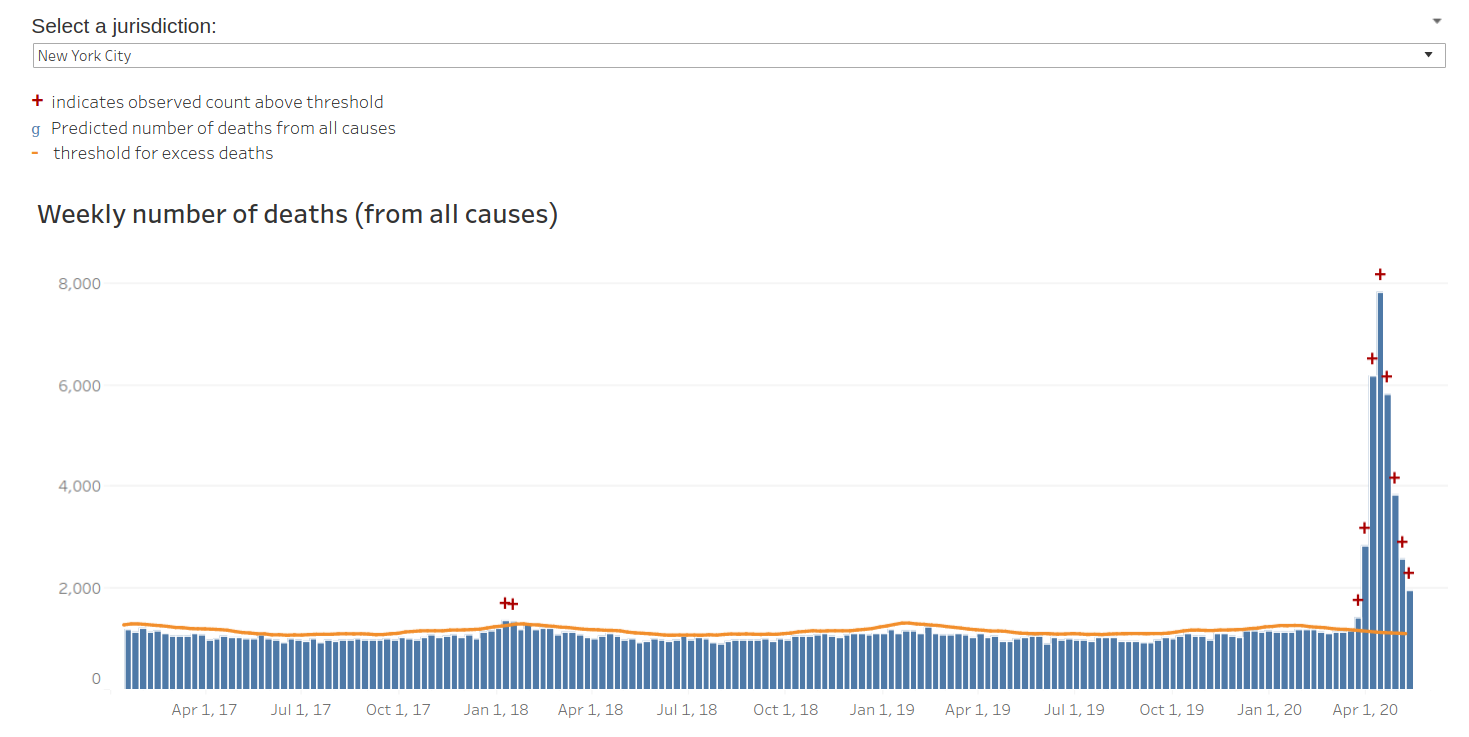
The blue bars are the number of people who died (from any cause) that week. It's hard to tell exactly what the date is for each bar, but we're just looking at the general trend, and the dates at the bottom of the graph are just to give you a general idea. If you go to the CDC's website, you can hover over each bar for details about that week. You can see that, while there is definitely a normal amount, there's also a bit of up and down variation from week to week, and it varies a bit by time of year also. So, how high does it have to get before one would say that it is an unusual event? That is the orange line. When the weekly deaths get above this point, the CDC says that there are "excess" deaths (a bad way of describing it, btw). The red plus signs highlight which weeks had more deaths than normal, AND they had so many more than normal that we can say there is something special going on (like, say, an epidemic). You can see that, in a typical week, they have something like 1000 people die (from any cause) in NYC. It's a city of over 8 million people, so even when things are normal a lot of people die in a week.
However, at the peak, they had over 7,000 people die, a month and a half's worth in one week. If we assume that the excess was from Covid-19, this means they had far more people dying from it than from all other causes combined.
Note that it could actually be worse than this if, for example, traffic fatalities were reduced due to the lockdown. One big advantage of this method, though, is that you don't have as much trouble with judgement. If the person was admitted to the hospital for unrelated reasons, and caught Covid-19 shortly before they died, do we count them? It's a tough call, and a tough call is easy to bias (even, perhaps especially, subconsciously). Whether or not the person is, in fact, dead, is easier and more objective. We know that about 1,000 people are expected to die in a typical week in NYC. When we have 8,000 die, we know the magnitude of our problem.
Now, let's look at the entire state of Texas, which includes, Houston, DFW, Austin, San Antonio, and many smaller cities, as well as a lot of rural population.
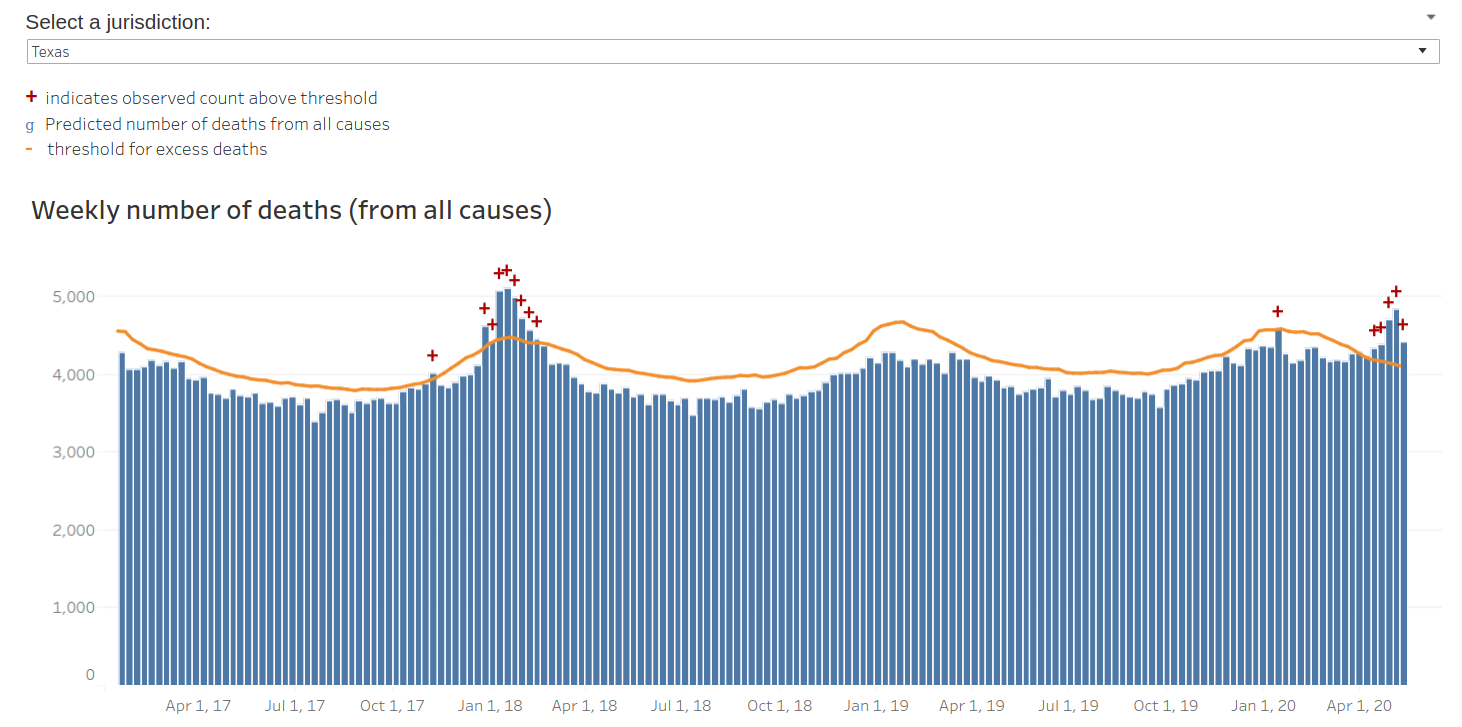
So, the state of Texas has about 4,000 people die in a normal week. In the week ending May 9, they had 4,800. This explains a great deal about how those who monitor (NYC-dominated) news have an entirely different impression of the scope of the problem, than those who do not. Note that this doesn't mean the NYC-focused perspective is in any way illusionary; it is very real. But it's not the same as that of Texas. Even within Texas, we see very different responses towards Covid-19 from the bigger cities and the smaller towns. They could both be right.
It's worth pointing out that there is another peak of "excess deaths" in the winter of 2017-2018. This was a year when the flu vaccine did not work, and we were (without talking about it as much) living through a virus epidemic without a vaccine. In Texas, this actually cost more lives than Covid-19 has. I recall that my father, who lived in a eldercare facility at the time, was occasionally confined to his room, because someone in the building had gotten the flu. When I talked to him about it on the phone, he was completely understanding that it was being done for his protection, but I could tell that it made him sad and kind of depressed. I sympathize even more now, than I did then.
For an intermediate take, let's look at the state of Illinois, where my dad was living at the time.
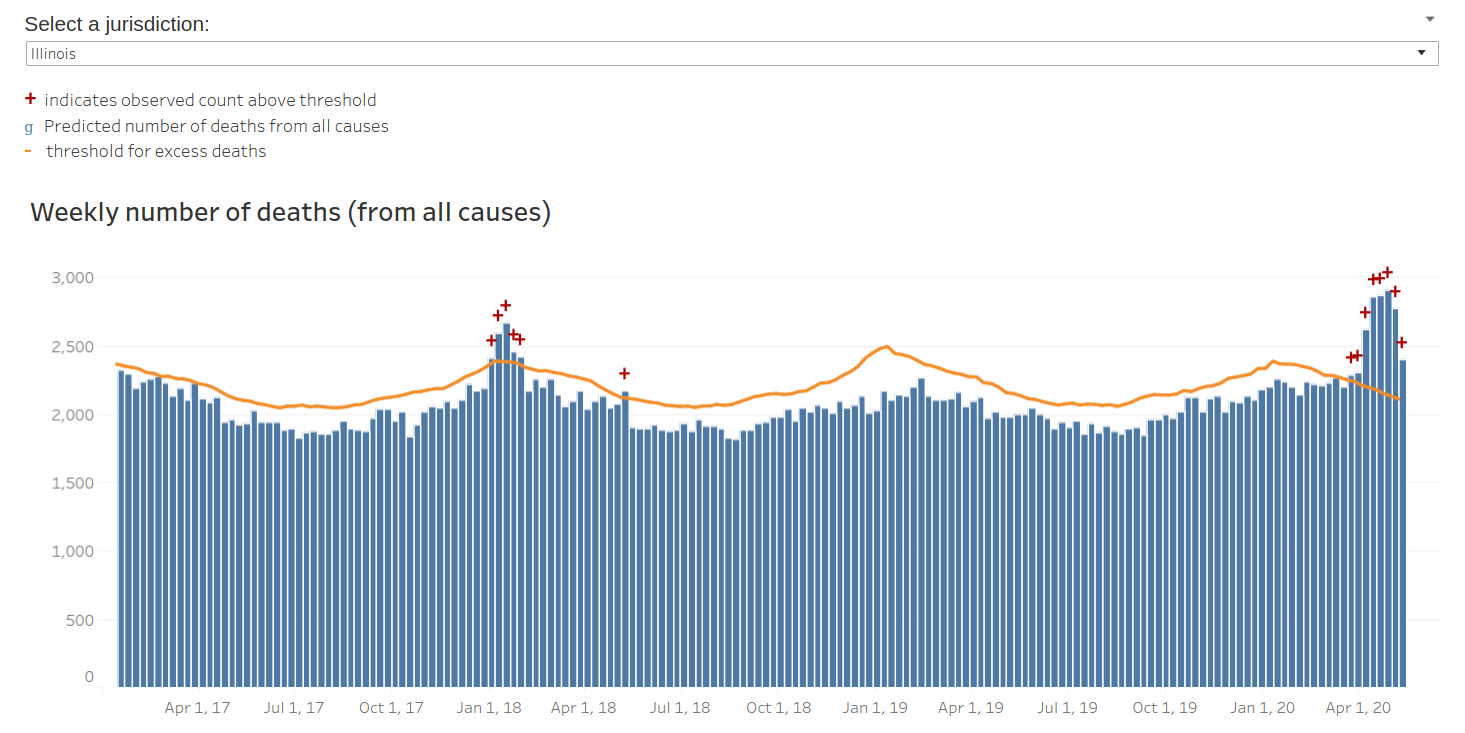
Here, we see a situation that is in some ways more similar to Texas than to NYC, but with one big difference. In Texas, the Covid-19 epidemic is actually turning out to be smaller (in mortality) than the 2017-2018 flu, but in Illinois it is turning out to be several times larger (maybe about 5x, very roughly speaking). It's nothing like the situation in NYC, but it's also nothing like the situation in Texas. When a (let's say fully rational and well-informed) Illinois citizen looks at the current virus, they see something worse than any virus they have probably ever lived through, unless they were around for the 1957 or 1968 influenza epidemics. When a (let's say fully rational and well-informed) Texas citizen looks at the current virus, they see something not as bad as what happened two years ago. Of course, in either case, if they are getting their news from media based in New York City, they may get an entirely different idea of the situation.
So, as I look at the responses of others to the current situation, and what we should or should not be doing about it, I am going to try to remember that it can look very different depending on where you're viewing it from.