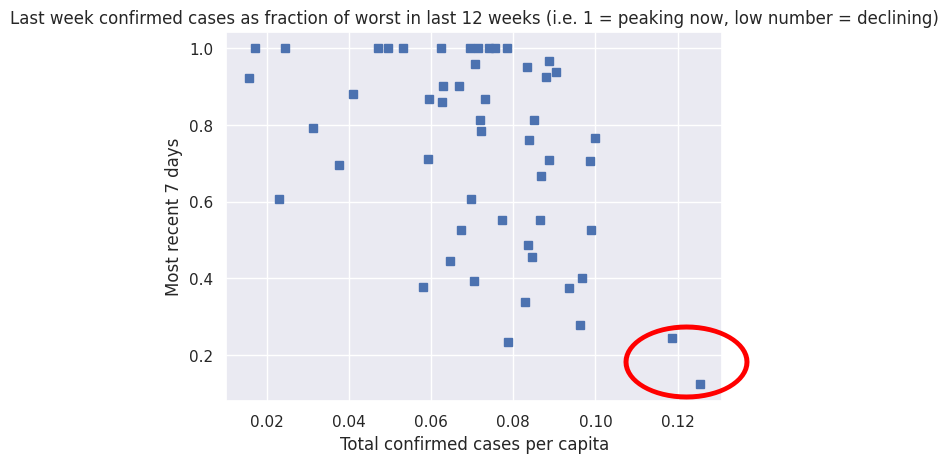
So, let's start the discussion with a graph, and then I'll explain what it means and where it came from:
Each point on this graph is one of the states, and the red ellipse shows where North and South Dakota are. The x axis shows the total number of confirmed cases of covid-19 in that state, since the beginning of the pandemic (per the CDC data, as pulled from John Hopkins' excellent github repository of covid-19 info). The Dakotas have had total confirmed cases in the neighborhood of 12% of their population.
The y axis, is comparing the most recent 7 days to the worst week (in that state) in the last 3 months. So, for example, Texas (currently peaking) looks like this: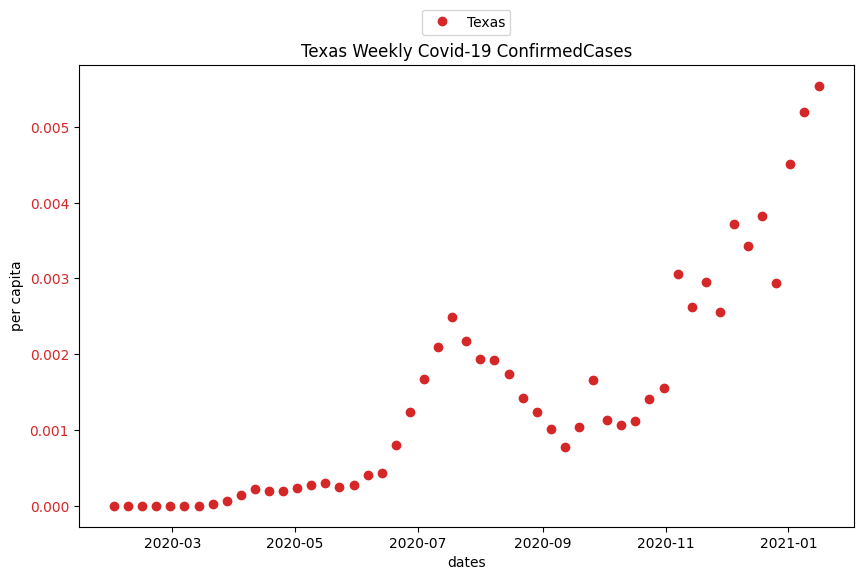
Therefore, Texas has a "1.0" on the y-axis, since the most recent 7 days are the highest level seen in the last 12 weeks (the current wave). New York, Louisiana, New Jersey, Hawaii, and a lot of other states are also at 1.0. However, some states like Illinois are at a lower level (in this case, 0.486).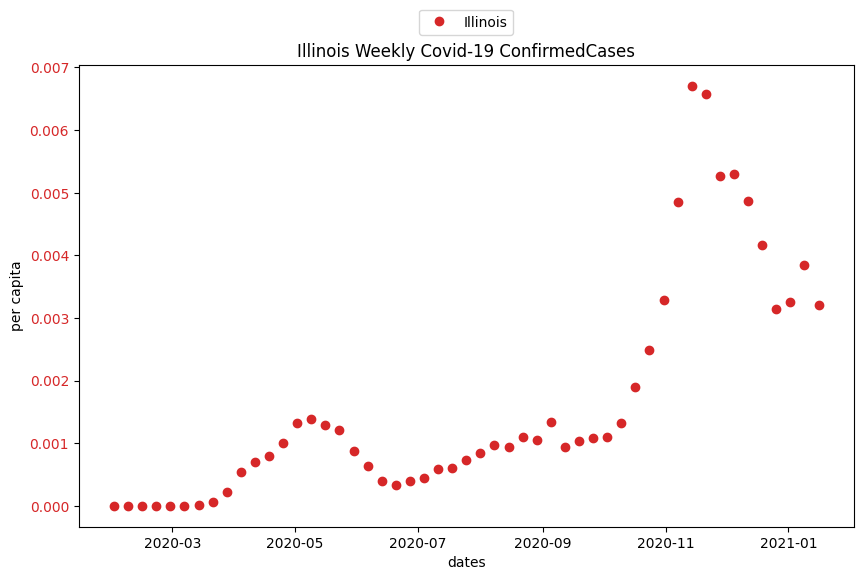
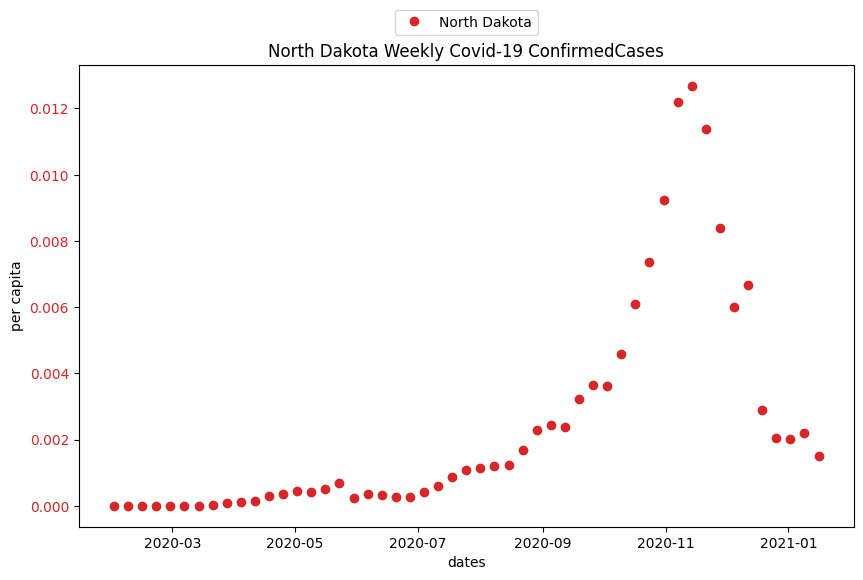
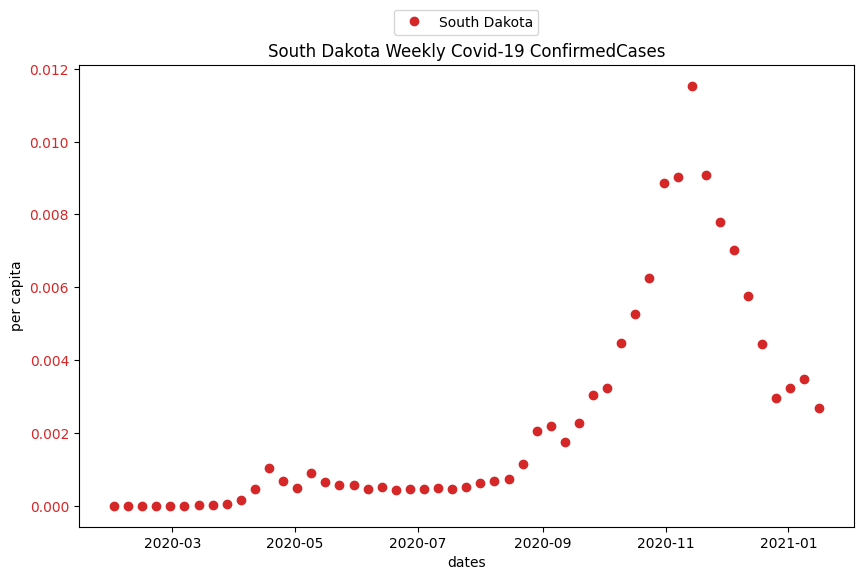
Note that the peaks for Texas and Illinois are not quite the same; Illinois' was a little higher, as a percent of the population. Different states have different populations, but also different population densities, and it's harder to stop an epidemic if people are living cheek by jowl in the same apartment building, for example. So each state is compared to the peak (worst) week for that state (out of the last 12), with 1.0 meaning the most recent week is the worst they've seen, and lower numbers meaning that it has gotten better than that. Here's what North and South Dakota look like.
Now, the fact that states with higher total confirmed cases, are seeing fewer cases now (per capita, compared to their peak in the last 3 months) is not in itself surprising. That's the way pandemics normally work. The fire burns through most of the dry tinder, and then it goes out. What is surprising is that we are seeing this already with a number as low as ~12%, as in the Dakotas. How can a number that low lead to herd immunity?
One thing that should be mentioned here is that "herd immunity" has nothing to do with "culling the herd", and also does not mean that every single member of the "herd" is immune. What it means is that the percentage of the population that are immune, is too high for an epidemic to be self-sustaining. If another person gets sick, most of the people they expose to the virus are already resistant, and not enough people get sick to keep things going. It's kind of like how the ash left behind after a campfire is not all, completely 100% consumed; there is often still more fuel there. But enough of it was turned to ash, that the fire was not self-sustaining. Once a population has reached "herd immunity", new exposures to the virus sputter and die out quickly. The odd thing is, that this should happen with a number as low as 12%.
One possibility, is that the previous estimates of needing 70% of the population to be resistant before you reach herd immunity, were simply incorrect. A lot depends on who exactly gets it, and if the people who are "super-spreaders" (people with service industry jobs who interact with a lot of other people in a day, for example) are also the first to get it (not an unreasonable guess), then the number could be a lot lower. If your 12% includes all the potential super-spreaders, maybe 12% is enough. That would be hard to manage, though, and my guess is that's not what's going on here.
The main issue is that not all people who get infected with covid-19, get this confirmed with a test. Some of them are asymptomatic, and never know they are infected. Some are not very sick, and don't get tested because there's no reason for them to (they're just going to stay home, regardless). Some people are afraid to know the truth. There may also be a few people who get counted more than once, if they get tested multiple times and test positive each time. So, we need a way to guess at the ratio of confirmed cases (including those who are double-counted), to actual cases (with no double-counting).
Estimates of the actual mortality rate for covid-19 are contentious, but John Ioannidis published a paper which collected together many different seroprevalence studies, to estimate something like 0.23% of people who get covid-19 will die from it. He points out that it could be different for different regions, though, either because of different strains or differences in the local population or healthcare response, so let's take an estimate of twice that for the U.S., or 0.46%. At about the same time as the data was collected (April and May), the U.S. had .05% confirmed cases per week, and 0.0015% deaths per week.
actual cases         .000015 deaths
------------    *    ---------------------    ===>   6.52 actual cases per confirmed case
.0046 deaths         .0005 confirmed cases
It would be nice to have some kind of double-check of this ratio. Fortunately, Slovakia provided one. "The country made international headlines as, over the last weekend of October, Slovak authorities tested almost all the country's adult population for coronavirus. A total of 3.6 million people out of an estimated 4 million target population were tested that weekend with a countrywide positivity rate of 1.06%." Given that the test was (necessarily, being cheap and capable of being deployed on such a massive scale) not as accurate as more conventional tests, the rate may have been as high as 2%. Given that conventional measures ("confirmed cases") was around 0.25%, that would give us a ratio of actual cases to confirmed cases somewhere in the range of 4-8.
Now, neither of these numbers are super-precise, and in any case, we should not expect the ratio of confirmed cases to actual cases to be the same everywhere. Different governments and different healthcare systems would be expected to result in a different likelihood for a person who is actually infected with covid-19, to go get tested to confirm it. But the fact that both methods, based on different datasets in different countries, provide similar answers, is encouraging that we are somewhere in the ballpark. For every "confirmed case", we have something like 4-8 people who have actually been infected with covid-19.
Now, the results in the Dakotas start to be less surprising.
If the number of confirmed cases per capita is 12.545% (North Dakota) or 11.862% (South Dakota), then the actual percentage of the population that have been infected is more like 70%. No wonder they have seen a precipitous decline in new cases in both states. But what about other states?
At the bottom of this web page, you will see a table of all of the states (plus D.C., Puerto Rico, etc.), and their total confirmed cases as a fraction of their total population. It also has the ratio of the most recent 7 days confirmed cases, to the worst week that state has had in the last 12 weeks (i.e. is it currently declining from its recent peak, or is it setting new record highs in which case it will be at 1.0). But if you want to look at them all in one graph, to see the overall trend, here it is again:
Note that, not only are the Dakotas very low (recently), but also all of the states with something like 10% cases per capita, are declining (numbers lower than 1). In fact, it appears that once a state hits 8%, it will start to have declining numbers of new cases each week. If 8% confirmed cases means something more like 48% of population having been already infected with the virus, this is not too surprising.
Well, it depends on what you think the vaccine is for. If you think it is to end the current pandemic, and we were all hiding out so that we would not get infected until the vaccine showed up, then yes, I'm afraid it means that the vaccine is probably showing up just too late to help with that (especially if you have to get both doses before you are immune). If you live in a state like Hawaii, Maine, or Vermont, with a total confirmed cases far below the levels of the Dakotas, then perhaps the vaccine may save some people even in this pandemic. Given that all of these states are experiencing record or near-record levels of new confirmed cases, though, I have my doubts.
It should be mentioned that currently North and South Dakota are two of the top three states in getting the vaccine rolled out. However, since they have only gotten about 5% of the population (and that's counting people who have only gotten one dose), I doubt that it is the main factor driving the recent decline. But it sure doesn't hurt.
But vaccines developed in response to a new virus have never showed up in time to help much with the first pandemic, so that is not really a knock on the people who developed these. We have had measles, mumps, rubella, etc. for many decades, and we still have to get vaccinated, because even though there's no pandemic of those three currently (knock on wood), we know they are still out there, and will eventually return. Vaccines help us to avoid repeating this whole pandemic every 20 years or so (for every virus), once there are enough people born after the last wave to provide "fresh fuel" for the fire. Given how stupid and crazy this pandemic has made people, I think we can all be thankful for that.
| Confirmed Cases per capita | State | Jan 8-15 Cases / Worst Week in last 12 |
|---|---|---|
| 0.085 | Alabama | 0.814 |
| 0.070 | Alaska | 0.393 |
| 0.090 | Arizona | 0.939 |
| 0.089 | Arkansas | 0.967 |
| 0.074 | California | 1.000 |
| 0.065 | Colorado | 0.445 |
| 0.063 | Connecticut | 0.859 |
| 0.071 | Delaware | 0.960 |
| 0.047 | District_of_Columbia | 1.000 |
| 0.072 | Florida | 0.785 |
| 0.075 | Georgia | 1.000 |
| 0.017 | Hawaii | 1.000 |
| 0.086 | Idaho | 0.552 |
| 0.084 | Illinois | 0.486 |
| 0.087 | Indiana | 0.668 |
| 0.096 | Iowa | 0.278 |
| 0.089 | Kansas | 0.710 |
| 0.072 | Kentucky | 0.812 |
| 0.078 | Louisiana | 1.000 |
| 0.024 | Maine | 1.000 |
| 0.053 | Maryland | 1.000 |
| 0.067 | Massachusetts | 0.903 |
| 0.058 | Michigan | 0.377 |
| 0.079 | Minnesota | 0.235 |
| 0.083 | Mississippi | 0.951 |
| 0.067 | Missouri | 0.527 |
| 0.083 | Montana | 0.339 |
| 0.094 | Nebraska | 0.376 |
| 0.084 | Nevada | 0.762 |
| 0.041 | New_Hampshire | 0.881 |
| 0.069 | New_Jersey | 1.000 |
| 0.077 | New_Mexico | 0.553 |
| 0.062 | New_York | 1.000 |
| 0.063 | North_Carolina | 0.903 |
| 0.125 | North_Dakota | 0.123 |
| 0.070 | Ohio | 0.608 |
| 0.088 | Oklahoma | 0.926 |
| 0.031 | Oregon | 0.793 |
| 0.059 | Pennsylvania | 0.711 |
| 0.023 | Puerto_Rico | 0.607 |
| 0.099 | Rhode_Island | 0.707 |
| 0.073 | South_Carolina | 0.867 |
| 0.119 | South_Dakota | 0.243 |
| 0.099 | Tennessee | 0.526 |
| 0.071 | Texas | 1.000 |
| 0.100 | Utah | 0.766 |
| 0.016 | Vermont | 0.924 |
| 0.050 | Virginia | 1.000 |
| 0.038 | Washington | 0.696 |
| 0.060 | West_Virginia | 0.868 |
| 0.097 | Wisconsin | 0.401 |
| 0.085 | Wyoming | 0.455 |